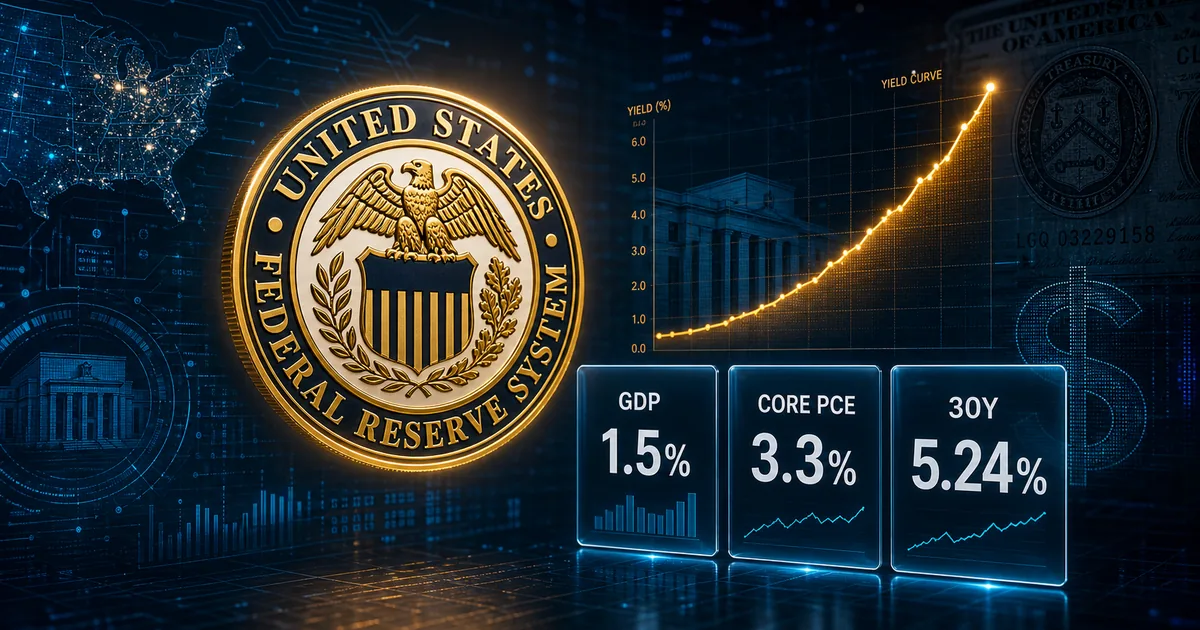
How Bitcoin fits into today’s financial system shown by Bitcoin coins in front of banks and stock market tickers

Bitcoin Crashes to $60,000 as Safe Haven Myth Shatters

Crypto

The “digital gold” narrative just ran headfirst into reality. Bitcoin plunged below $67,000 to $60,000 before recovering to 66k on Thursday, touching its lowest level since October 2024, as a brutal week of selling erased nearly half of the gains from Donald Trump’s election victory

Candlestick charts showing bullish and bearish patterns with green and red formations on professional trading platform

What Are Candlestick Charts and Why Do Traders Rely on Them?

Trade

Candlestick charts transform raw price data into visual stories that traders have relied on for centuries. Originally developed by 18th-century Japanese rice merchants, these patterns now dominate modern trading platforms from Wall Street to cryptocurrency exchanges. Understanding how to read candlestick formations means spotting market

Crypto Market Signals Explained 2

Crypto Market Signals Explained: How Moving Averages, Macro Forces, and Stock Correlations Drive Digital Asset Prices

Crypto

Crypto market signals have become increasingly complex as digital assets mature from speculative playthings into legitimate components of the global financial system. Understanding what moves Bitcoin, Ethereum, and the broader cryptocurrency market now requires fluency in technical indicators, macroeconomic forces, and the growing correlation between

Scroll to Top