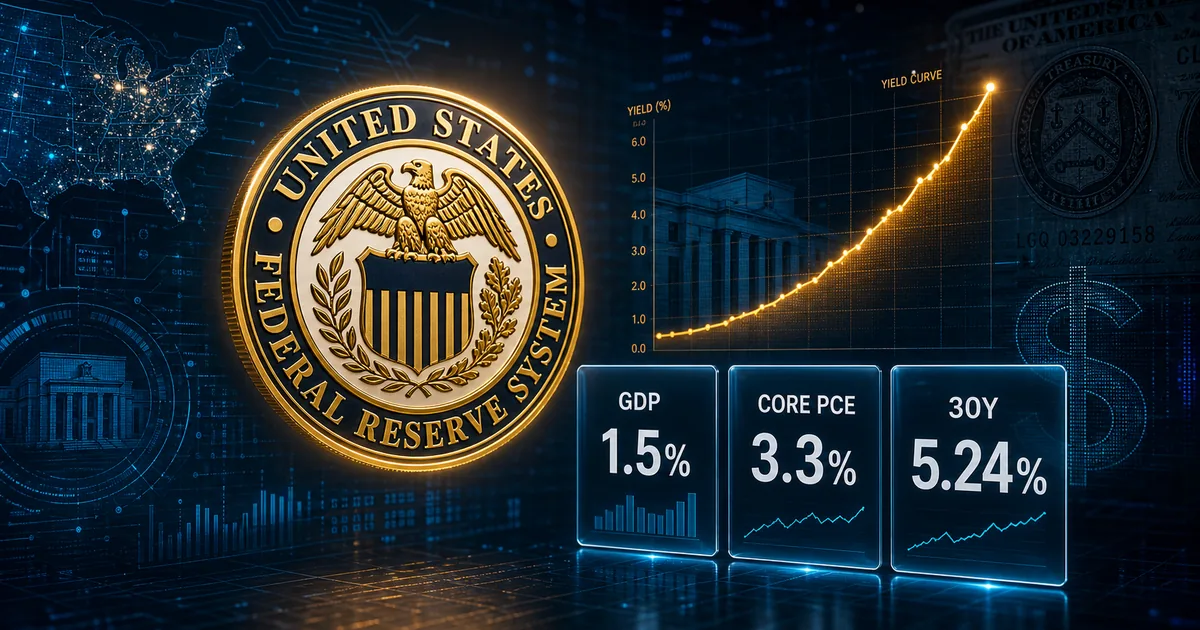
The Bureau of Economic Analysis reported Thursday that real GDP grew at a 1.5% annual rate in the second quarter, down from 2.1% in the first, and the story wrote itself: the economy is losing altitude. Read four lines further into the same release and it says close to the opposite.
The Slowdown Is Mostly Arithmetic
Buried under the headline number is the measure economists actually use to read domestic momentum. Real final sales to private domestic purchasers, which is consumer spending plus private fixed investment with the trade and inventory noise stripped out, rose 3.9% in the second quarter, up from 1.7% in the first. That is not a cooling economy. That is domestic demand more than doubling its pace in three months.
So where did the growth go? Into the import line, which GDP subtracts. BEA notes that imports rose in the second quarter, and rose faster than they did in the first. The composition matters: the surge is heavily AI hardware, the servers, networking gear and power equipment landing in the United States to fill data centers that do not exist yet. We covered the mechanism in June when the trade deficit hit $105 billion and clipped the GDP print, and the second quarter is the same trade doing it at scale. When Nvidia commits $250 billion to backstop OpenAI’s Ohio buildout, a meaningful share of that check clears customs before it clears anything else.
The other subtraction was government. BEA attributes the quarter’s deceleration to a downturn in government spending alongside slower investment and export growth. Federal outlays falling out of the number is a policy choice showing up as a growth statistic, not evidence that private activity weakened. Economists polled by LSEG had expected 2.1%, so the miss is real. It is just not a miss about demand.
Nominal Growth Was 7.9%
Here is the number nobody put in a headline. Current-dollar GDP expanded at a 7.9% annual rate last quarter. Real output took 1.5 points of that. Prices took the rest. The price index for gross domestic purchases climbed 5.7%, up from 3.6% in the first quarter, and the PCE price index inside the GDP accounts ran at 5.1%. An economy growing at 7.9% in dollars and 1.5% in goods and services is not slowing down. It is being converted into inflation.
Households Are Funding This out of Savings
The monthly data released the same morning shows who is paying for the demand acceleration. Personal income rose 0.2% in June. Spending rose 0.3%, and real spending rose 0.4%. Outlays outran income for the month, and the personal saving rate fell to 2.7%, down from 3.0% in May and roughly half the rate households were running in early 2025.
That is the part of the release that should worry anyone modeling the back half of the year. Consumption at 3.9% annualized is impressive when it is funded by wages. It is fragile when it is funded by a shrinking savings buffer, because a buffer that thin gives households no room to absorb a job loss, a tariff pass-through, or another energy spike. The strength in the demand data and the weakness in the savings data are the same fact viewed from two sides.
June’s inflation prints were the genuinely encouraging piece. The headline PCE price index fell 0.1% on the month and came in 3.7% above a year earlier, cooling from 4.1% in May. Core PCE rose 0.1% on the month, undershooting forecasts, and eased to 3.3% year over year from 3.4%. Within the quarter, core actually decelerated hard, to 3.4% annualized from 4.4% in the first quarter, which means most of that 5.1% headline burn was energy working its way through after the spring oil disruption.
The Long Bond Voted Before the Data Landed
None of this softened the bond market. The Federal Open Market Committee held the target range at 3.50% to 3.75% on Wednesday on a 9-3 vote, with three members dissenting in favor of a quarter-point hike. Traders had spent the week debating whether Kevin Warsh would deliver a surprise increase in his second meeting as chair. He did not, and the long end punished the patience anyway.
The 30-year Treasury yield jumped more than 10 basis points to 5.201% and touched 5.244%, its highest level since July 2007. The 10-year reached 4.67%. The two-year, the maturity that tracks near-term policy expectations, went the other way. That is a curve steepening on term premium, and the translation is unambiguous: investors are less worried about the Fed hiking soon and more worried about what inflation looks like in a decade. A 5.2% long bond reprices every mortgage, every commercial real estate refinancing, and every AI data center project underwritten on cheaper capital. The buildout inflating the import line is the same buildout that gets more expensive when the long end sells off.
Warsh inherited a committee that already had nine officials penciling in at least one hike this year and has spent his tenure telling markets that price stability outranks the employment half of the mandate. Thursday’s data gave him something to point at in both directions, which is the least useful outcome available.
What September Actually Decides
The soft headline and the cooling core give the majority cover to wait for July and August CPI before moving. The 3.9% demand number and the 7.9% nominal print give the three dissenters everything they need to keep dissenting. Both readings are correct, which is why this committee is going to keep splitting.
The question that resolves it is not whether growth is slowing. On the evidence of this release, it isn’t. The question is whether an economy running 3.9% private demand against a 2.7% savings rate can absorb another quarter of 3%-plus core inflation without either the consumer or the bond market breaking first. September’s meeting will be decided by which one cracks.